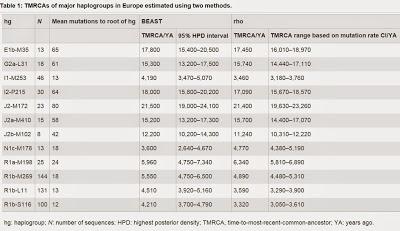
Source - http://dienekes.blogspot.fr/

The time estimates are based on a mutation rate of 1x10⁻⁹ mutations/bp/year which is ~1/3 higher than mutation rate of Karmin et al. So the values on the table may be a little lower.
There may be additional founders with recent time depths than shown in the table, e.g., a very shallow clusters within E-M35 (probably E-V13?) and a couple of shallow clusters within I-P215
 Also of interest is the fact that Greeks and Anatolian Turks do not show evidence of the recent Y-chromosomal bottleneck:
The plots are consistent with patterns seen in the relative numbers of singletons, described above, in that the Saami and Palestinians show markedly different demographic histories compared with the rest, featuring very recent reductions, while the Turks and Greeks show evidence of general expansion, with increased growth rate around 14 KYA. A different pattern is seen in the remaining majority (13/17) of populations, which share remarkably similar histories featuring a minimum effective population size ~2.1–4.2 KYA (considering the 95% confidence intervals (CIs) reported in Supplementary Table 4), followed by expansion to the present.

Nature Communications 6, Article number: 7152 doi:10.1038/ncomms8152