The Bantu völkerwanderung
Razib Khan
Source - http://blogs.discovermagazine.com/gnxp/2011/03/the-bantu-volkerwanderung/

Image Credit: Mark Dingemanse
I recall years ago someone on the blog of Jonathan Edelstein, a soc.history.what-if alum as well, mentioning offhand that archaeologists had “debunked” the idea of the Bantu demographic expansion. Because, unfortunately, much of archaeology consists of ideologically contingent fashion it was certainly plausible to me that archaeologists had “debunked” the expansion of the Bantu peoples. But how to explain the clear linguistic uniformity of the Bantu dialects, from Xhosa of South Africa, up through Angola and Kenya, to Cameroon? One extreme model could be a sort of rapid cultural diffusion, perhaps mediated by a trivial demographic impact. The spread of English exhibits this hybrid dynamic. In some areas (e.g., Australia) there was a substantial, even dominant, English demographic migration coincident with the rise of Anglo culture. In other areas, such as Jamaica, by and large the crystallization of an Anglophone culture arose atop a different demographic substrate, which synthesized with the Anglo institutions (e.g., English language and Protestant religion). The United States could arguably be held up as a in-between case, with an English founding core population, around which there was an accretion of a non-Anglo-Saxon stream of immigrants who serial adopted the Anglo culture, more or less. Sometimes this co-option of Anglo-Saxon norms may surprise. “Black English” (i.e., Ebonics) actually seems to be a genetic descendant of lower class northern English dialects. Other distinctive components of black American (e.g., “jumping the broom“) culture can also plausibly be derived back to the British Isles.
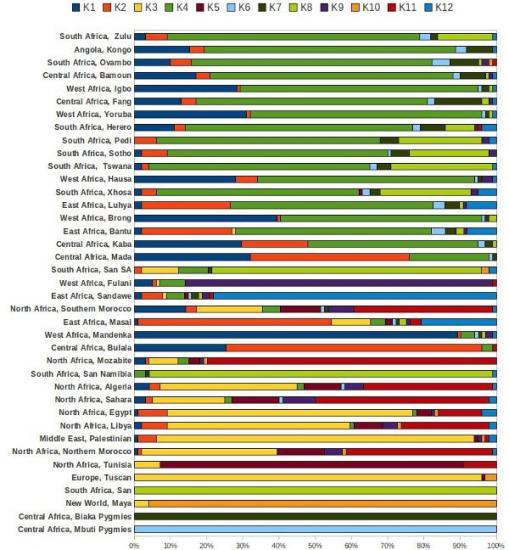
So cultural change is in the “its complicated” segment of dynamics. We have to go on a case-by-case basis. For the Bantu expansion though we have a good answer now thanks to genetics: this cultural change almost certainly was accompanied by a massive demographic migration. Thanks to Brenna Henn and company you can even run some analyses on your desktop to confirm the reality of this model. I pulled down the 55,000 SNPs from various African populations, merged with Palestinians, Tuscans, and Maya as outgroups, and pruned down to ~40,000 after removing those which were missing in more than 1% of the cases. The Hadza are also gone, as they’re such a small isolated group who always hogged up K’s all by themselves. I ran a bunch of different ADMIXTURES, from K = 2 to 12. You can see all 12 here, but let’s just focus on the 12th.
Below is a bar plot, somewhat sorted by ADMIXTURE elements. I’ve reedited some of the labels for clarity, adding regions. I’m sure some of you are ignorant of where the Brong people (Ghana) are from as I was before I looked them up. Also, please be careful about ADMIXTURE. There is a “Fulani” ancestral component below, but I’m 90% sure that’s just an artifact of recent Fulani demograhics + their unique genetic admixture.

K4, the dark green component, seems associated with Bantus and Bantu neighbors all across Africa. The lack of correspondence to geography is clearly suggestive of demographic leapfrogging. The existence of non-Bantu peoples in the wake of their migration (e.g., the Nilotic peoples in northeast Africa, the Pygmies, and the Sandawe) could be indicative of either ecological constraints on the Bantu toolkit (so the migrants simply moved around the uncongenial zones), or a later intrusion (this is often hypothesized to be what occurred to bring the Masai to Tanzania). There are no Horn of Africa samples here, but I have some 23andMe files, and I can tell you that it seems as Dienekes observed, the Sub-Saharan component among the people of Ethiopia and Somali seems singularly lacking the Bantu element. Why? My own suspicion is that this region had its own agricultural (or pastoralist) way of life which rendered them demographically robust in the face of the Bantu, who simply turned south once they reached a zone of serious cultural resistance.
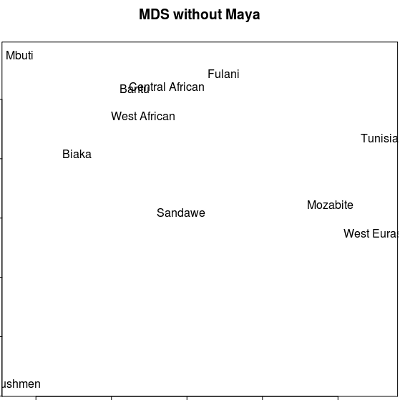
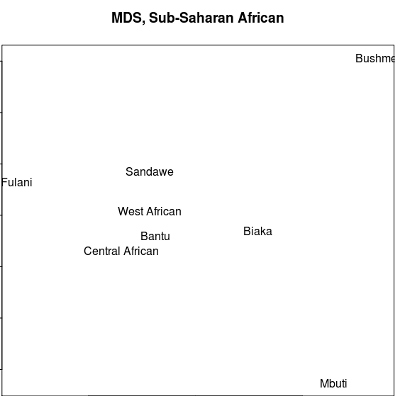
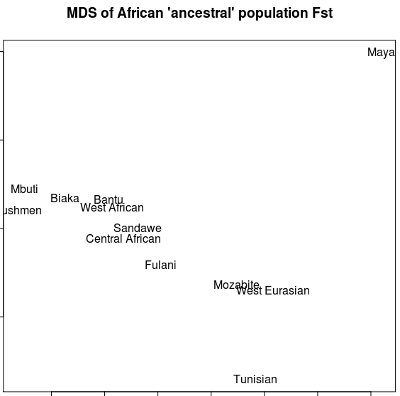
But there’s more. Of course there are Fst, genetic distances, between these “ancestral” populations. You can find these, along with the frequencies, in an Excel file I uploaded. But let’s look at how the populations related to each other on an MDS plot, which visualizes the pairwise distances on a two dimensional plane. I’ve added labels this time. They should be pretty clear in terms of which K’s they correspond to.


For what it’s worth, the Sandawe are presumed to be the aboriginal people of Tanzania, at least in relation to the dominant Bantu around them.